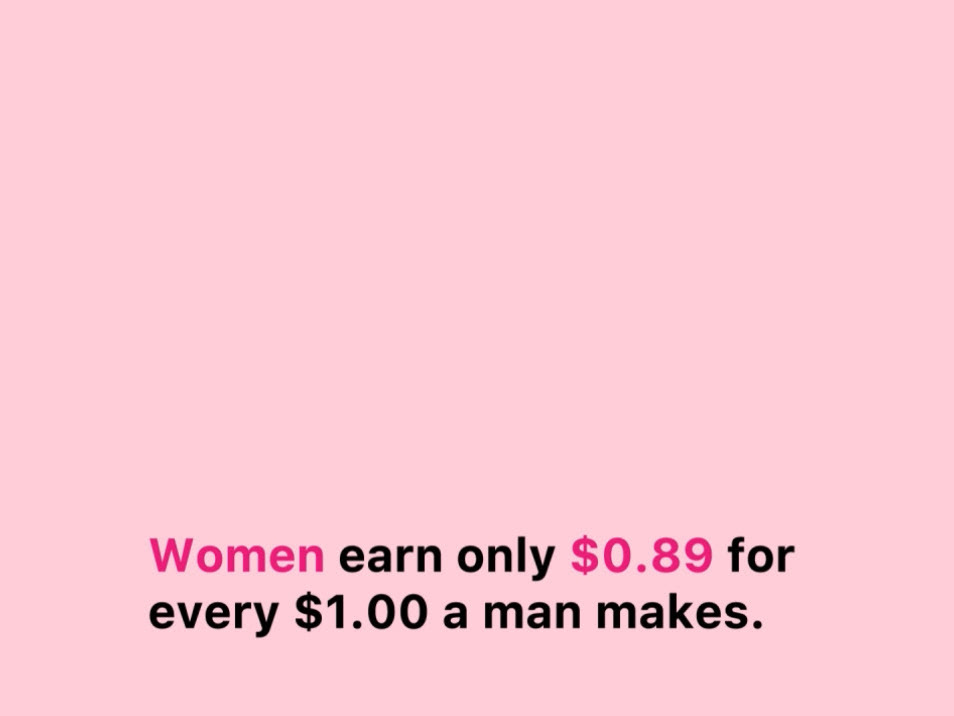
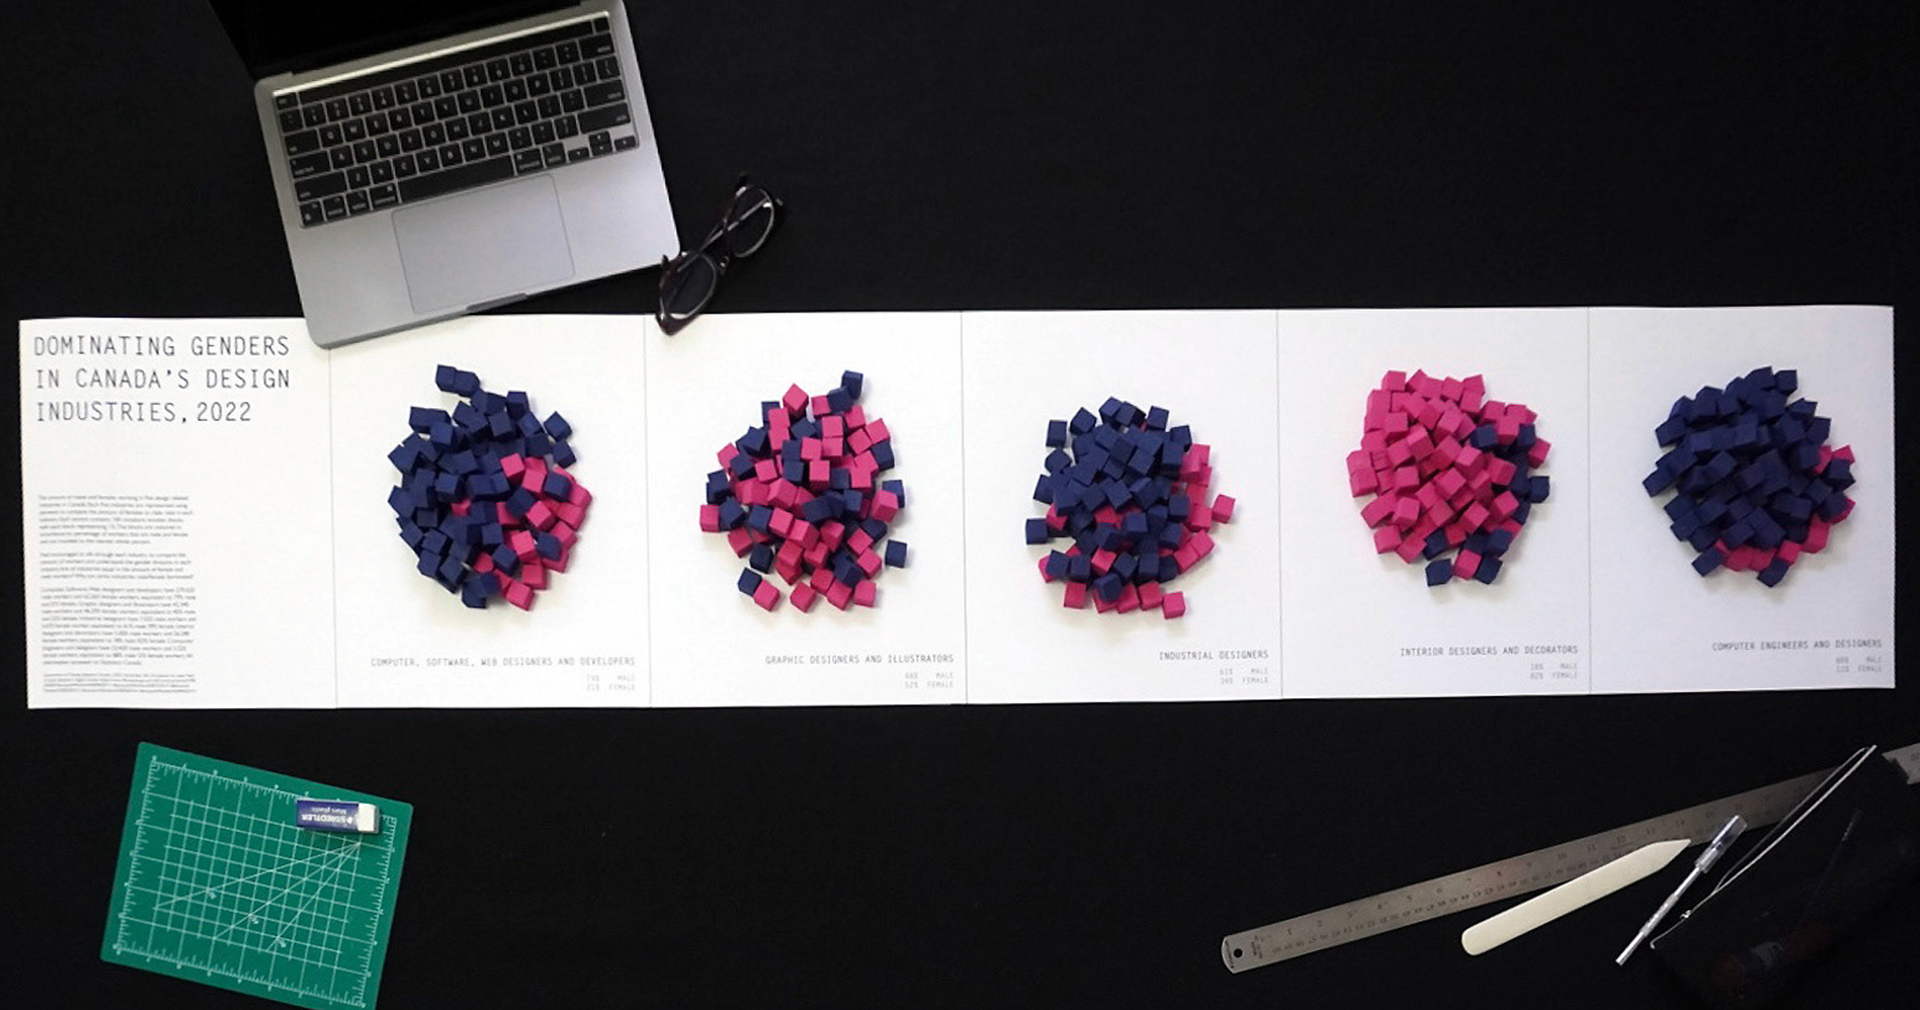
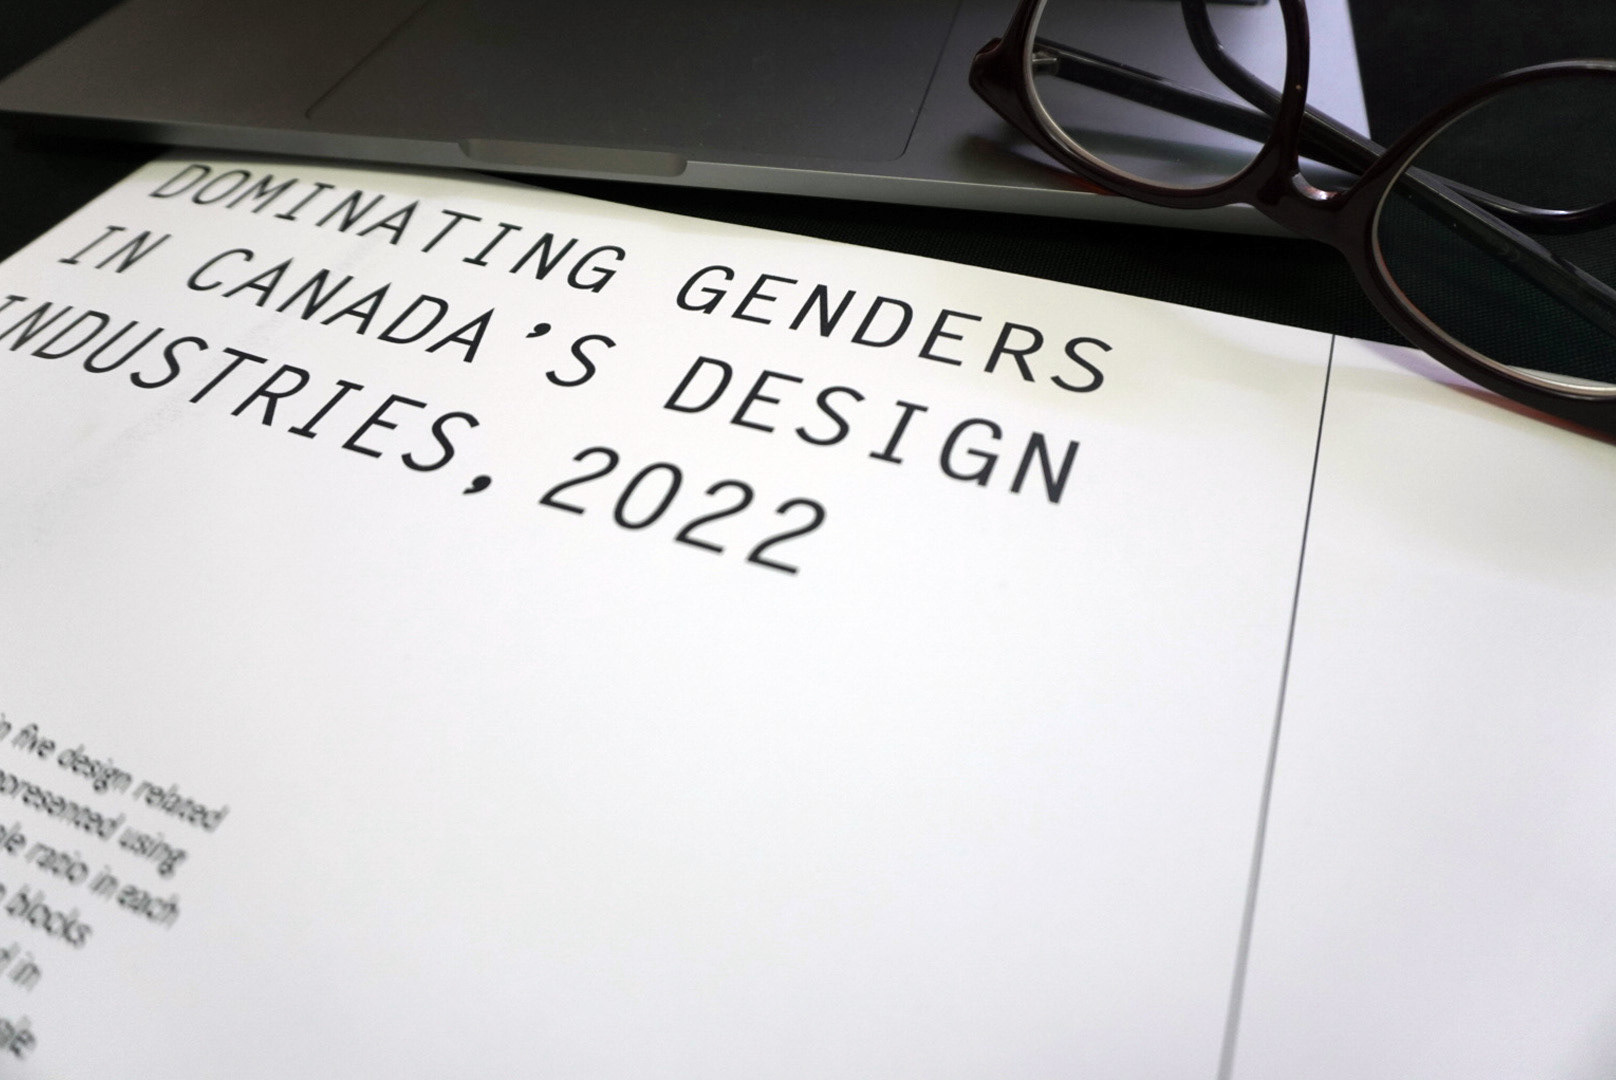
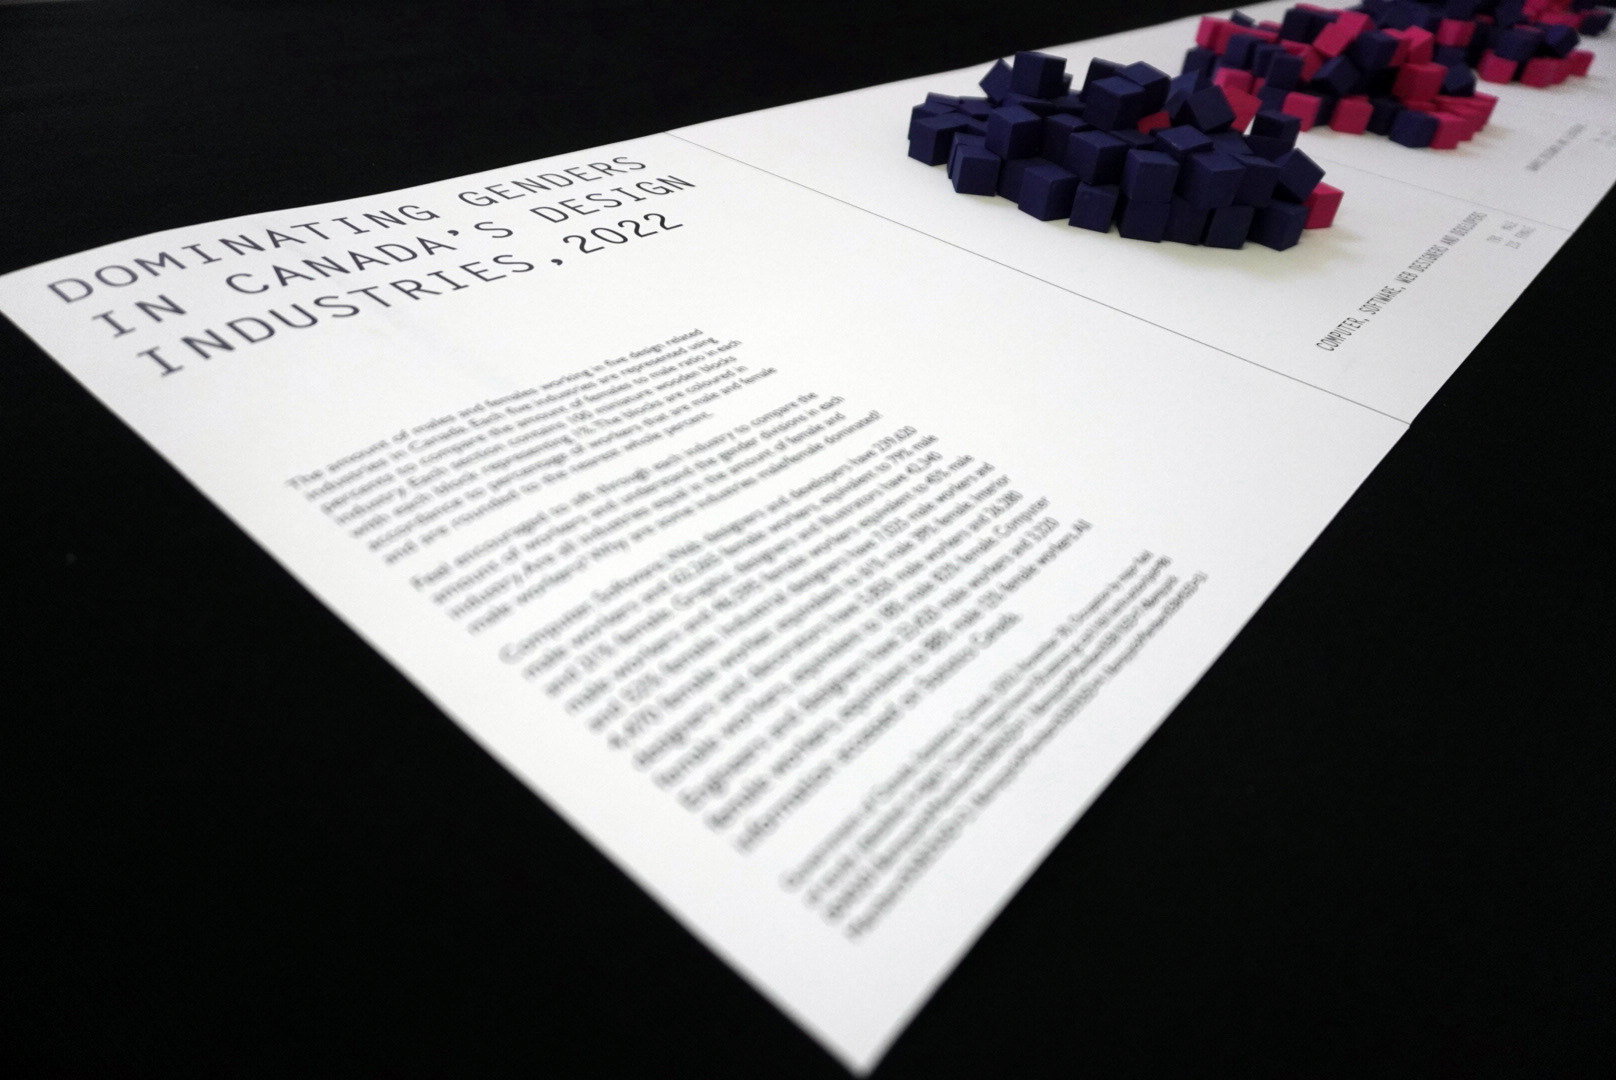
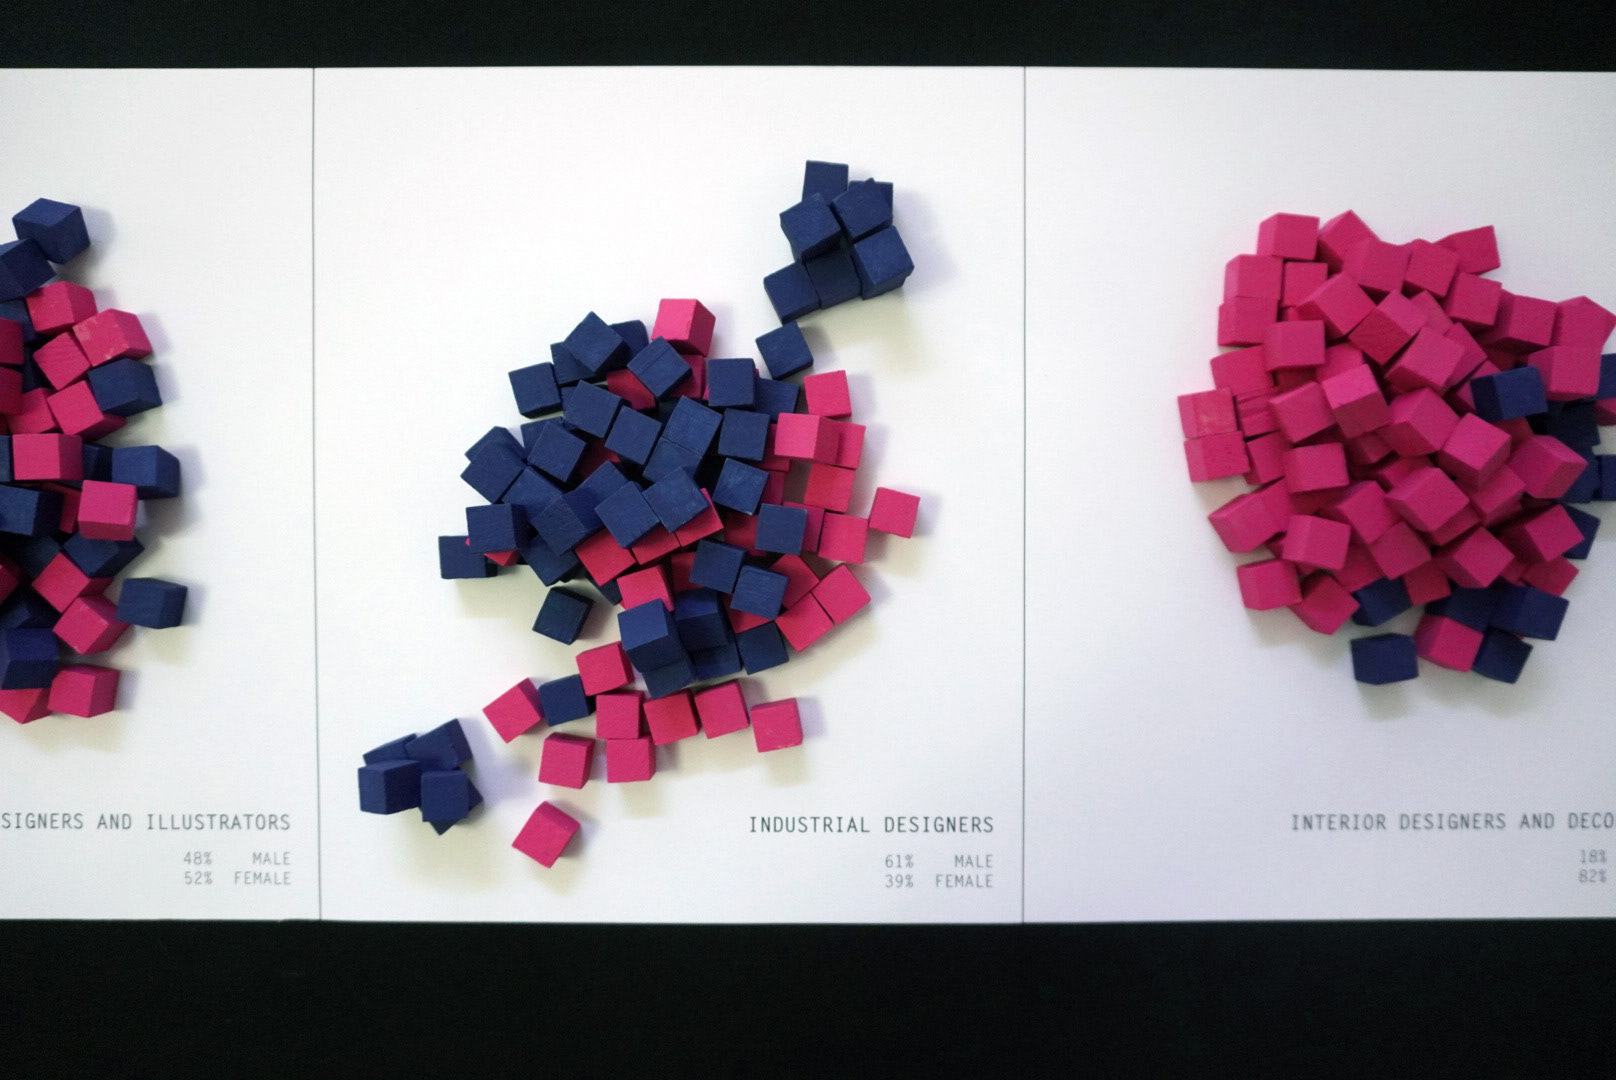
DOMINATING GENDERS IN CANADA'S DESIGN INDUSTRIES
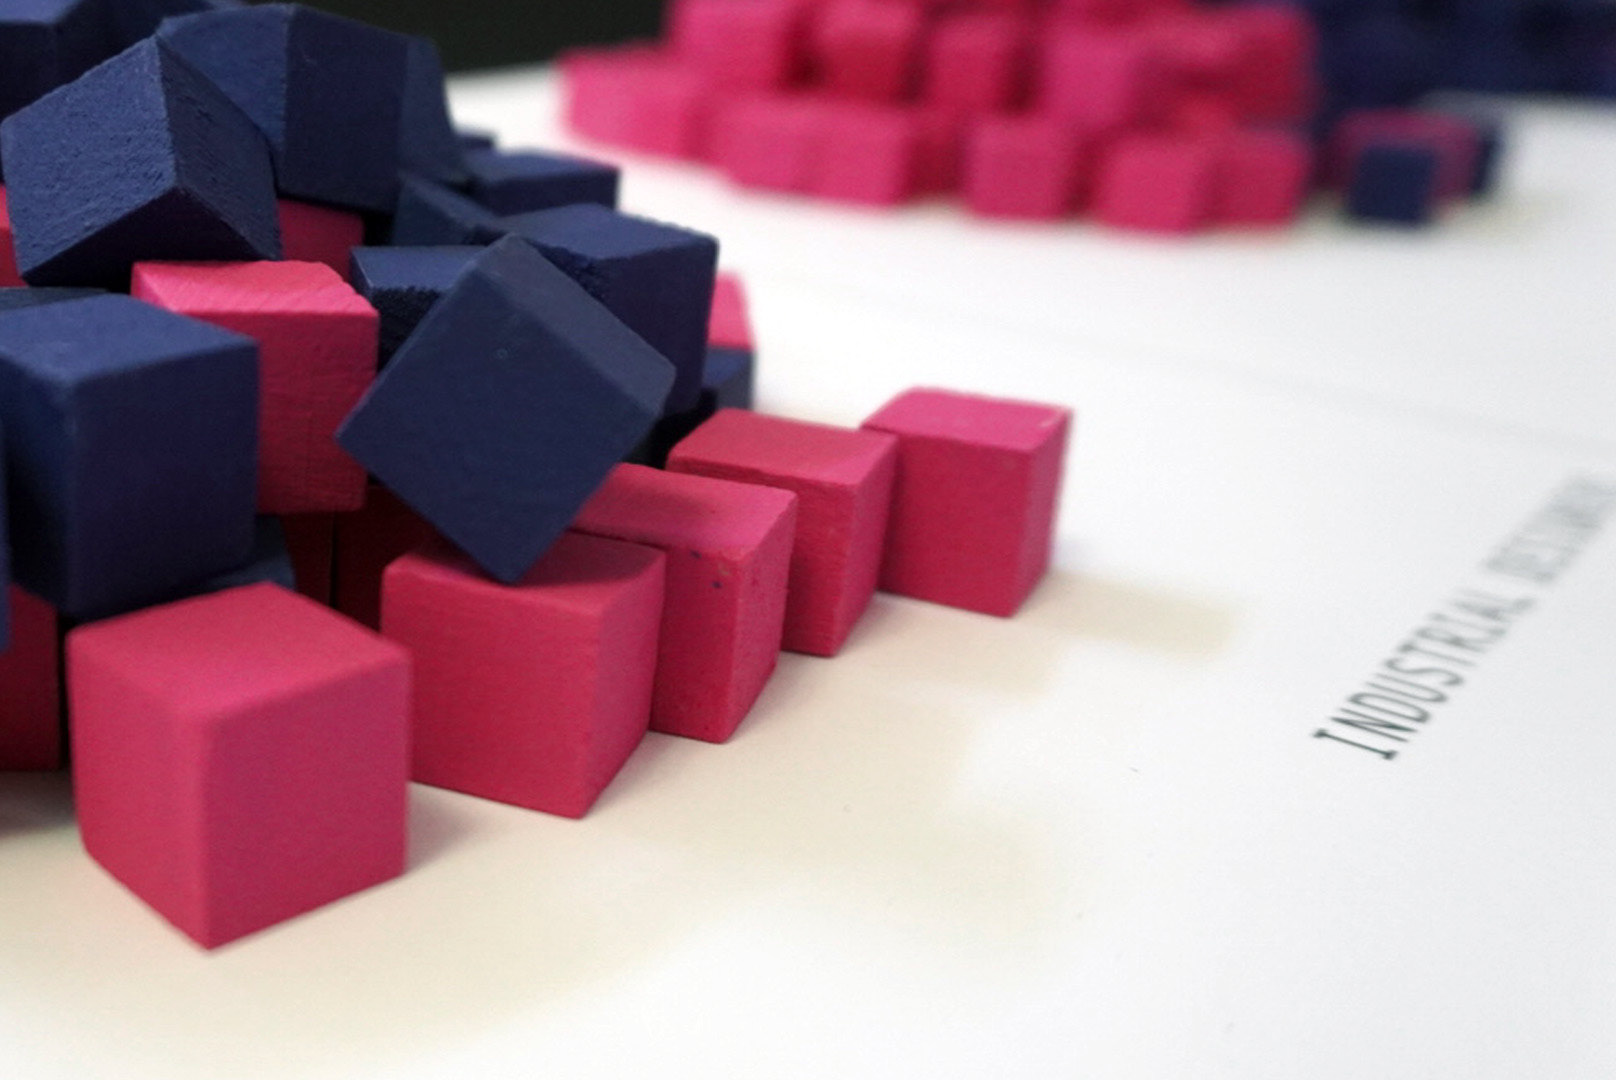
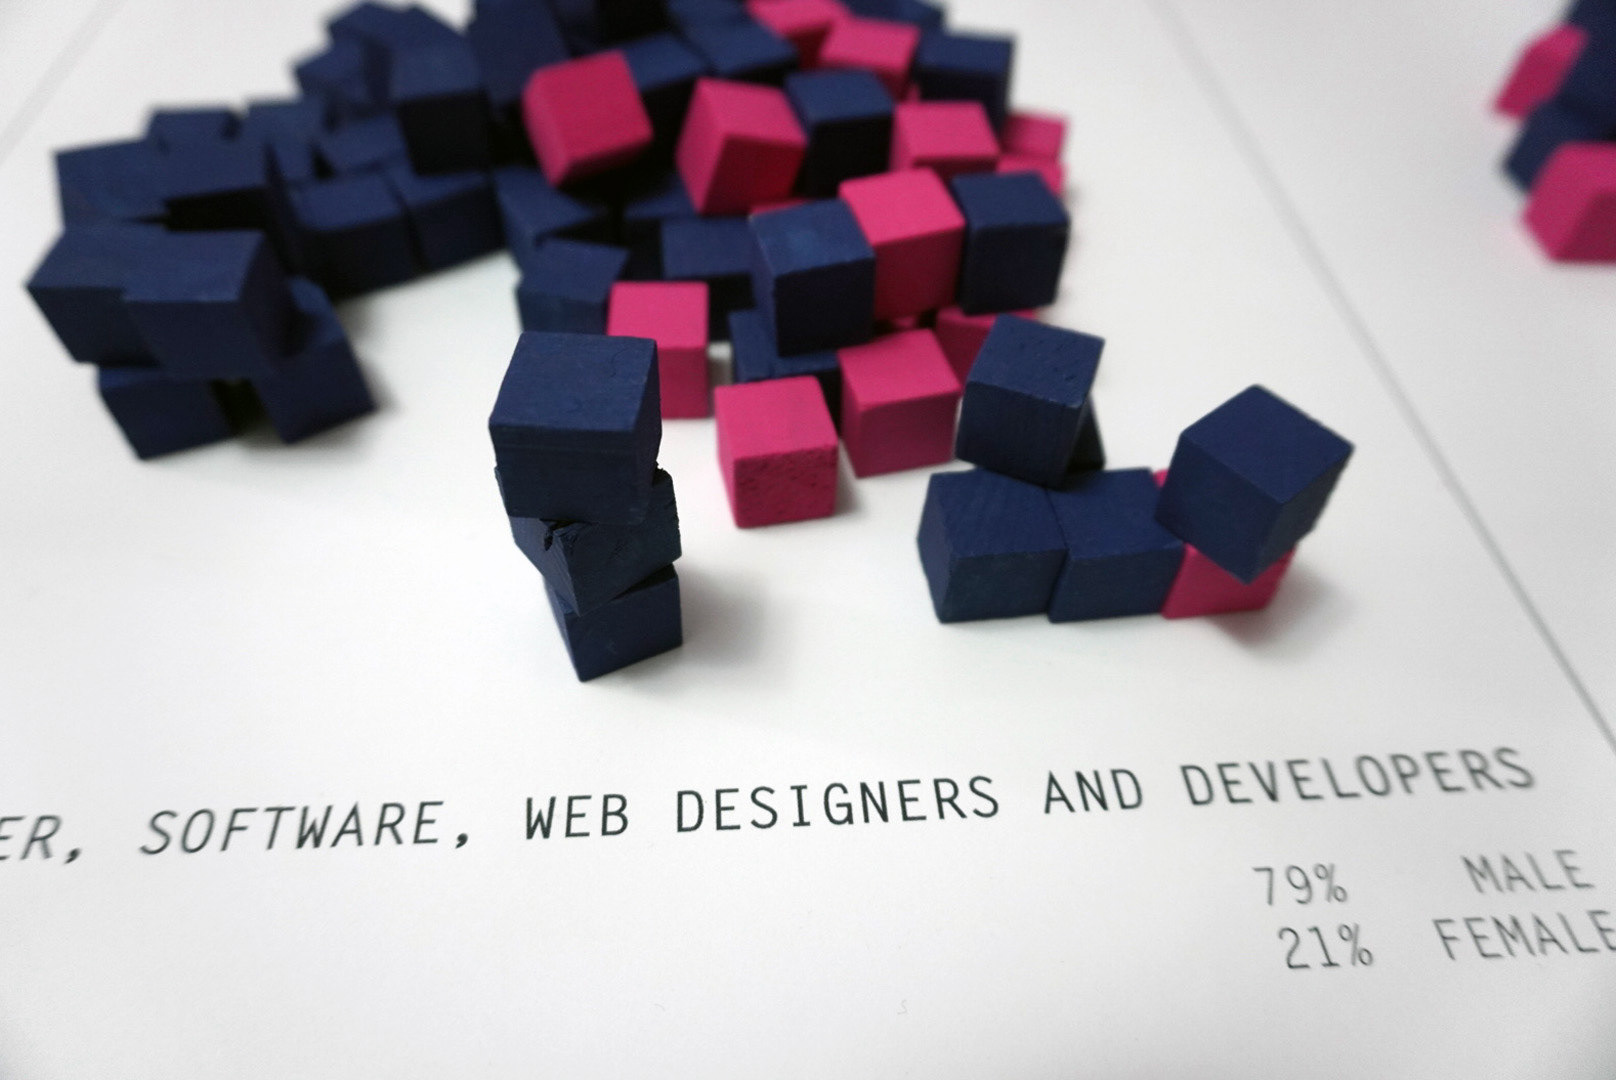
The data manifestation takes a dataset published on Statistics Canada in 2022 about the amount of male and female workers in the Canadian labour market. With the objective to create a rather heavy dataset and find a way to contextualize and visualize the data in a physical way that is easier to process to a specific market of people. I took the data and represented the five major design related industries and the amount of female and male workers in each sector. the data is represented in a scroll measuring at a size of sixty by twelve inches and is divided into the five major industries. Industries includes a pile of 100 miniature one by one inch wooden blocks to represent 100 percent of the workers. Each block is coloured either blue or pink to represent the percentage of male or female worker. The goal for the manifestation is to turn the numbers into percents allowing for it to be easy to understand with the viewer and interact with the materials in front of them. From a distant, it does not take long to understand that some industries are male dominated with the increased number of blue blocks in comparison to the pink blocks. this is made for a fast analyzation of the data.
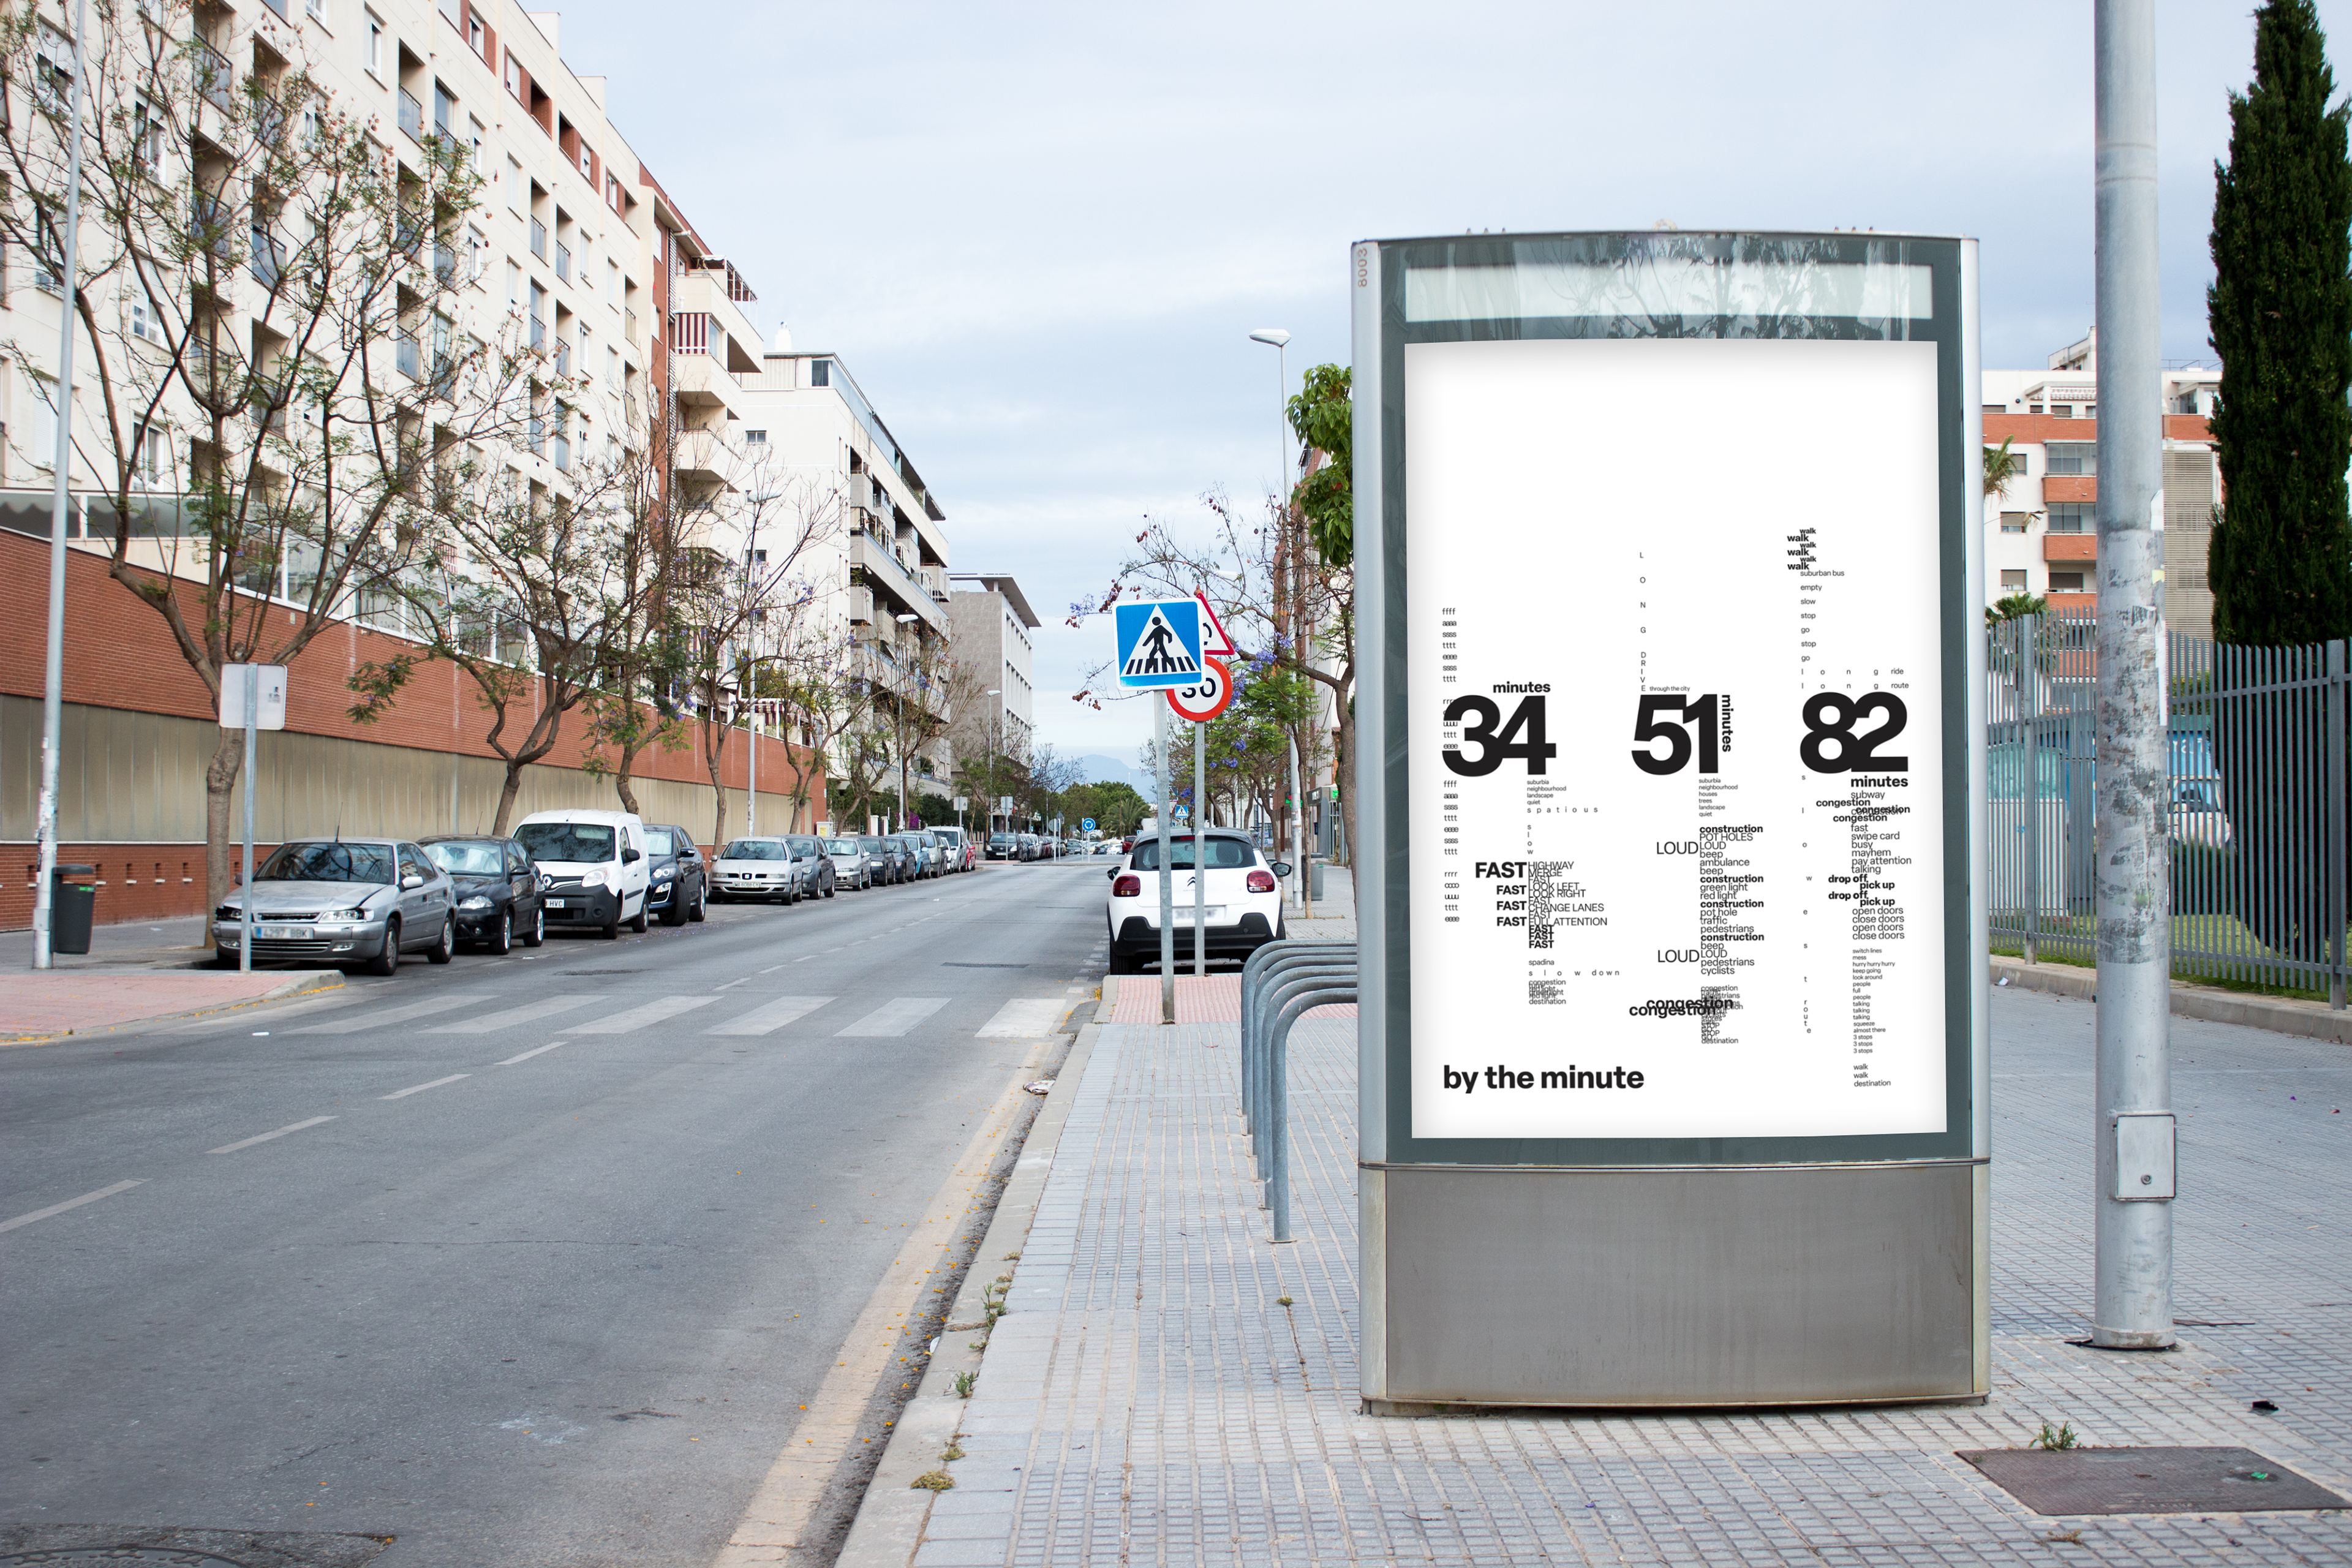
BY THE MINUTE
Typographical poster to deliver data that analyzes the three different travel routes that I take from home to OCAD University campus. After collecting the data from each route, I was able to illustrate the differences in the routes by formatting the typography in a way that mimics the que's heard, seen, and felt during each different route. The final product measures at a size of 17 x 25 inches and is fabricated to deliver a story using only typographical elements. Poster mockup photo Designed by berlionemore_contributor / Freepik.